Imagine three conference rooms: in one, a health officer addresses a committee; in the second, a wildlife manager addresses a state wildlife commission; and in the third, a product manager addresses a team of department heads. When asked “will this program work?”, each says “I don’t know.” Are these people describing the same uncertainty?
Wicked problems are those with no definitive formulation, no stopping rule, and no single “right or wrong” solution (only better and worse ones), and in which each attempt at a solution has lasting consequences, so trial and error is costly.1 Examples include homelessness, many ecological and conservation challenges, and strategic corporate decisions. One hallmark of such problems is that there are many things about them that are uncertain, and this uncertainty can take many forms. Sometimes our ability to predict future behavior given past conditions is poor; often there is natural variability that no amount of additional data can address; and sometimes the very structure of the problem is uncertain. In other words, not all types of “we don’t know” are the same, and understanding which regime of uncertainty we are in can tell us a lot about the tools we have to address them.
It turns out that while the hallmark of wicked problems is that each one is unique, the commonalities in types of uncertainty across them provide a consistent toolbox to approach solutions. In this post, I’ll describe multiple different types of uncertainty that appear in wicked problems across many domains, and in the next post I’ll describe tools that have emerged in different disciplines to address each type.
Causal models: drawing a picture of the problem
A consistent approach across disciplines to addressing wicked problems is first to draw a picture of the inputs, the possible interventions, and what we think the likely outcomes might be. Decision Intelligence has formalized this as a Causal Decision Diagram (CDD). In this formulation, externals represent things we can’t control about the problem but that affect the outcomes, levers are the actions we can take, intermediates are variables that sit between the levers and the outcomes, and outcomes are those outputs we would like to achieve. A simple example is shown below, and we will return to this example in the next post as well.
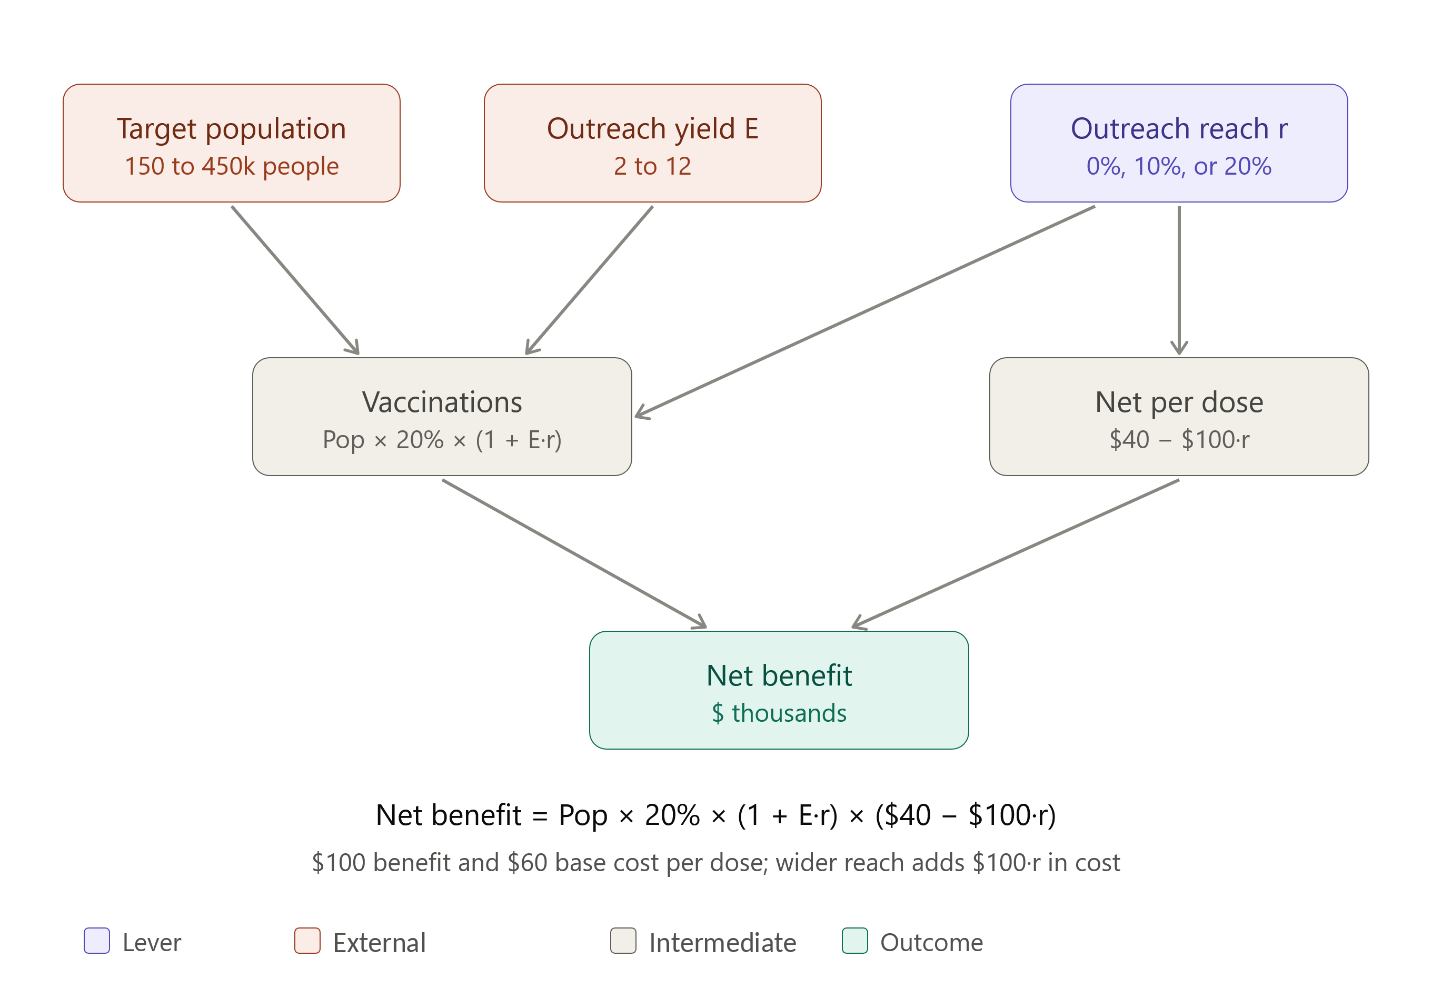
Figure 1. A Casual Decision diagram (CDD) of a model vaccination program; values are examples and not reflective of any real program.
This CDD represents a model public vaccination problem: a public health agency plans to conduct outreach to a specified percentage of a population in the hope of convincing individuals to become vaccinated (the lever, upper right in purple). The target population size and outreach yield are externals (upper left, in red; we don’t control these, but they affect the outcome). The number of vaccinations and the net benefit per dose are intermediates (center), which combine to affect the desired outcome, the net benefit (bottom, in green). The CDD also specifies a linear relationship between the net benefit and the outreach reach, with the slope determined by the outreach yield E and the population and the net benefit per dose as multiplicative constants. The last important aspect of the CDD is that some uncertainties have already been specified: the outreach yield varies between 2 and 12, while the population varies between 150,000 and 450,000 people. We will return to this below.
Uncertainty in defining the problem
The first question to ask when solving any problem is “what is the problem we are trying to solve?” Wicked problems make this question among the hardest to answer. In the CDD above, the causal structure looks clean: we know the externals, we have a single lever, and arrows flow cleanly in one direction. But what happens if we can’t draw this picture? Maybe political or cultural opposition limits what the agency can do, or maybe vaccinating one adult in a family makes the children less likely to be vaccinated later. Each possibility adds a node, an arrow, or even a feedback loop that the original diagram does not have.
When the framing of the problem or the very structure of the causal model is uncertain, we are in a regime called deep uncertainty.2 In this regime, we often cannot agree on, or defend, probabilities for the key elements of this diagram, or even on how many nodes it should contain. Disagreement about how to value outcomes, described next, is a third face of deep uncertainty when it cannot be resolved.
Uncertainty in defining the outcomes
The next question to ask when solving any problem is “how will we know when we have solved it?” As noted above, wicked problems have no stopping rule (they are never fully solved), so the better question to ask is “How do we know when we are headed in the right direction?” This question, however, can be one of the largest forms of uncertainty in wicked problems. That’s because answering it requires agreement among stakeholders about which outcomes are desired. This is fundamentally a values question. Do we care more about total health gained, measured in quality-adjusted life years (QALYs), or about equity in who gets vaccinated? How important are the economics of the program? If we cannot agree about what constitutes success, we are in a regime of values uncertainty. More data cannot settle this kind of disagreement; it takes deliberation among the people affected. When forming a decision team, most of the time is often spent on these questions.
One common reason for disagreement about values and outcomes is due to the language that stakeholders use to describe what they envision. Terms like “recovered” species, or “high risk” can have different definitions depending on who is using them.3 This linguistic uncertainty is best handled early in the formation of a decision team, when desired outcomes are first being discussed. Robust facilitation can make a low-cost impact on decision quality by resolving linguistic uncertainty.
Uncertainty we cannot reduce
If we can draw a CDD like the one above, then two additional types of uncertainty appear. The first relates to natural variability that additional data will not remove. An unexpected storm might affect how many people arrive to a vaccination clinic on a given day, or a social media post might go viral about the vaccination program. If no amount of additional sampling will narrow the distributions of these variables but we can still describe their shapes and plan around them, then we have a type of uncertainty known as aleatoric uncertainty.
Uncertainty we can reduce
Each of the links in the causal diagram above represents a functional relationship between an input and an output, and each node has its own distribution of possible values. By acquiring more data about each node, we may tighten our understanding of their ranges of values. This is known as epistemic uncertainty, and comes in four subtypes:
- Measurement error: if we undercount the number of unvaccinated residents, then we underestimate the size of our target population. By surveying the population more precisely, we can lower this uncertainty.
- Systematic error (bias): if it is easier to reach some residents than others (through social media or physical location), then our estimates of the target population and the yield will be skewed toward certain types of people and may not reflect the underlying demographics. Unlike random measurement error, collecting more of the same data does not fix this; it takes a different way of sampling.
- Parameter uncertainty: a certain amount of outreach will raise the uptake of the vaccination program (the yield E), but how large is that effect? A small pilot program could narrow the plausible range.
- Model uncertainty: Even if we knew every parameter exactly, we could still have the wrong form for a link in our diagram. Does vaccination uptake rise in proportion to yield E, or does it saturate at some point? Note also that we could move from model uncertainty back to deep uncertainty if we cannot determine what alternative model forms may exist.
An important boundary exists between aleatoric and epistemic uncertainty; which side of the boundary we are on depends on the models and data in hand.4 For instance, if a weather model with a larger training set could have predicted the storm described above as aleatoric, this moves weather events into epistemic uncertainty instead.
A shared pattern across wicked problems
Now that we have described the major classes of uncertainty for our vaccination program example, it’s important to understand that these types of uncertainty appear across wicked problems in many disciplines. Below is a table with examples from public health, conservation ecology, and corporate enterprise. The conservation example is a manager deciding whether to move frogs to a new pond while a disease is spreading; the enterprise example is a product manager deciding how deep a discount should be.
Uncertainty Type | Public health (vaccination outreach) | Conservation (frog translocation) | Enterprise (pricing discount) |
|---|---|---|---|
Aleatoric | Weekly turnout varies by weather and chance | Year-to-year disease outbreaks and rainfall | Daily demand noise |
Epistemic: measurement error | Survey undercounts unvaccinated residents | Imperfect detection when counting frogs | Mis-tagged sales data |
Epistemic: systematic error / bias | Volunteers sampled are easier to reach | Surveys only at accessible ponds | Test customers are loyal buyers |
Epistemic: parameter uncertainty | How much outreach raises uptake (the yield E) | Survival of released frogs with disease present | Price elasticity of demand |
Epistemic: model uncertainty | Does outreach lift uptake linearly or saturate? | Is disease or habitat the main driver? | Does a discount reduce full-price sales? |
Values | Equity versus total doses | Number of sites versus persistence | Profit versus loyalty |
Deep | A new variant changes how vaccines work | Climate shift rewrites the ecosystem | A new competitor reshapes the market |
Our three conference rooms may therefore all have different answers to the question about whether the programs will work, depending on the types of uncertainty involved.
Fortunately, various disciplines have all contributed tools to address these classes of uncertainty, and these tools can be applied across disciplines. In the next post, I will describe these tools and examples of their application to the types of wicked problems described here.
References and further reading
Rittel, H. & Webber, M. Dilemmas in a General Theory of Planning. Policy Sci. 4, 155–169 (1973).
Lempert, R. J., Popper, S. W. & Bankes, S. C. Shaping the Next One Hundred Years: New Methods for Quantitative, Long-Term Policy Analysis. https://www.rand.org/pubs/monograph_reports/MR1626.html (2003).
Carey, J. M. & Burgman, M. A. Linguistic Uncertainty in Qualitative Risk Analysis and How to Minimize It. Ann. N. Y. Acad. Sci. 1128, 13–17 (2008).
Kiureghian, A. D. & Ditlevsen, O. Aleatory or epistemic? Does it matter? Struct. Saf. 31, 105–112 (2009).