From Causal Diagrams to Recommendations: The Role of Causal Analysis
You and your team have built a Causal Decision Diagram (CDD): a map of levers you can pull, outside factors you can't control, the outcomes you care about, and the chain of intermediate effects connecting them. Everyone around the table agrees it looks right. That agreement and the CDD are valuable: many decision intelligence (DI) efforts stop right here, using the CDD alone to sharpen thinking and build consensus.
But two questions remain. Is the diagram actually right (does it match what the data shows)? And how do you turn an agreed-upon diagram into a tool that generates real recommendations for new cases, month after month?
This is where causal analysis, a maturing branch of statistical algorithms, comes in. Getting from a CDD to a working recommendation engine involves two distinct kinds of work: causal discovery, which checks whether your CDD holds up against the data, and causal inference, which uses a validated CDD to estimate the effect of a given decision. We'll walk through both, using a single running example: a county health department deciding how to run a naloxone distribution program to prevent opioid overdose deaths.
Causal Discovery: Does the Diagram Match the Data?
Say your team has drafted a CDD for a naloxone program, something like the diagram below. It has two levers you control (how many naloxone kits to distribute and how many outreach sites to staff); two externals you don't control (the potency of fentanyl in the local drug supply, and how much housing instability there is in the community); two intermediates that form the causal chain (how many at-risk people actually end up carrying a kit, and how quickly naloxone gets administered when an overdose happens); and two outcomes (fatal overdoses and nonfatal overdoses requiring emergency care).
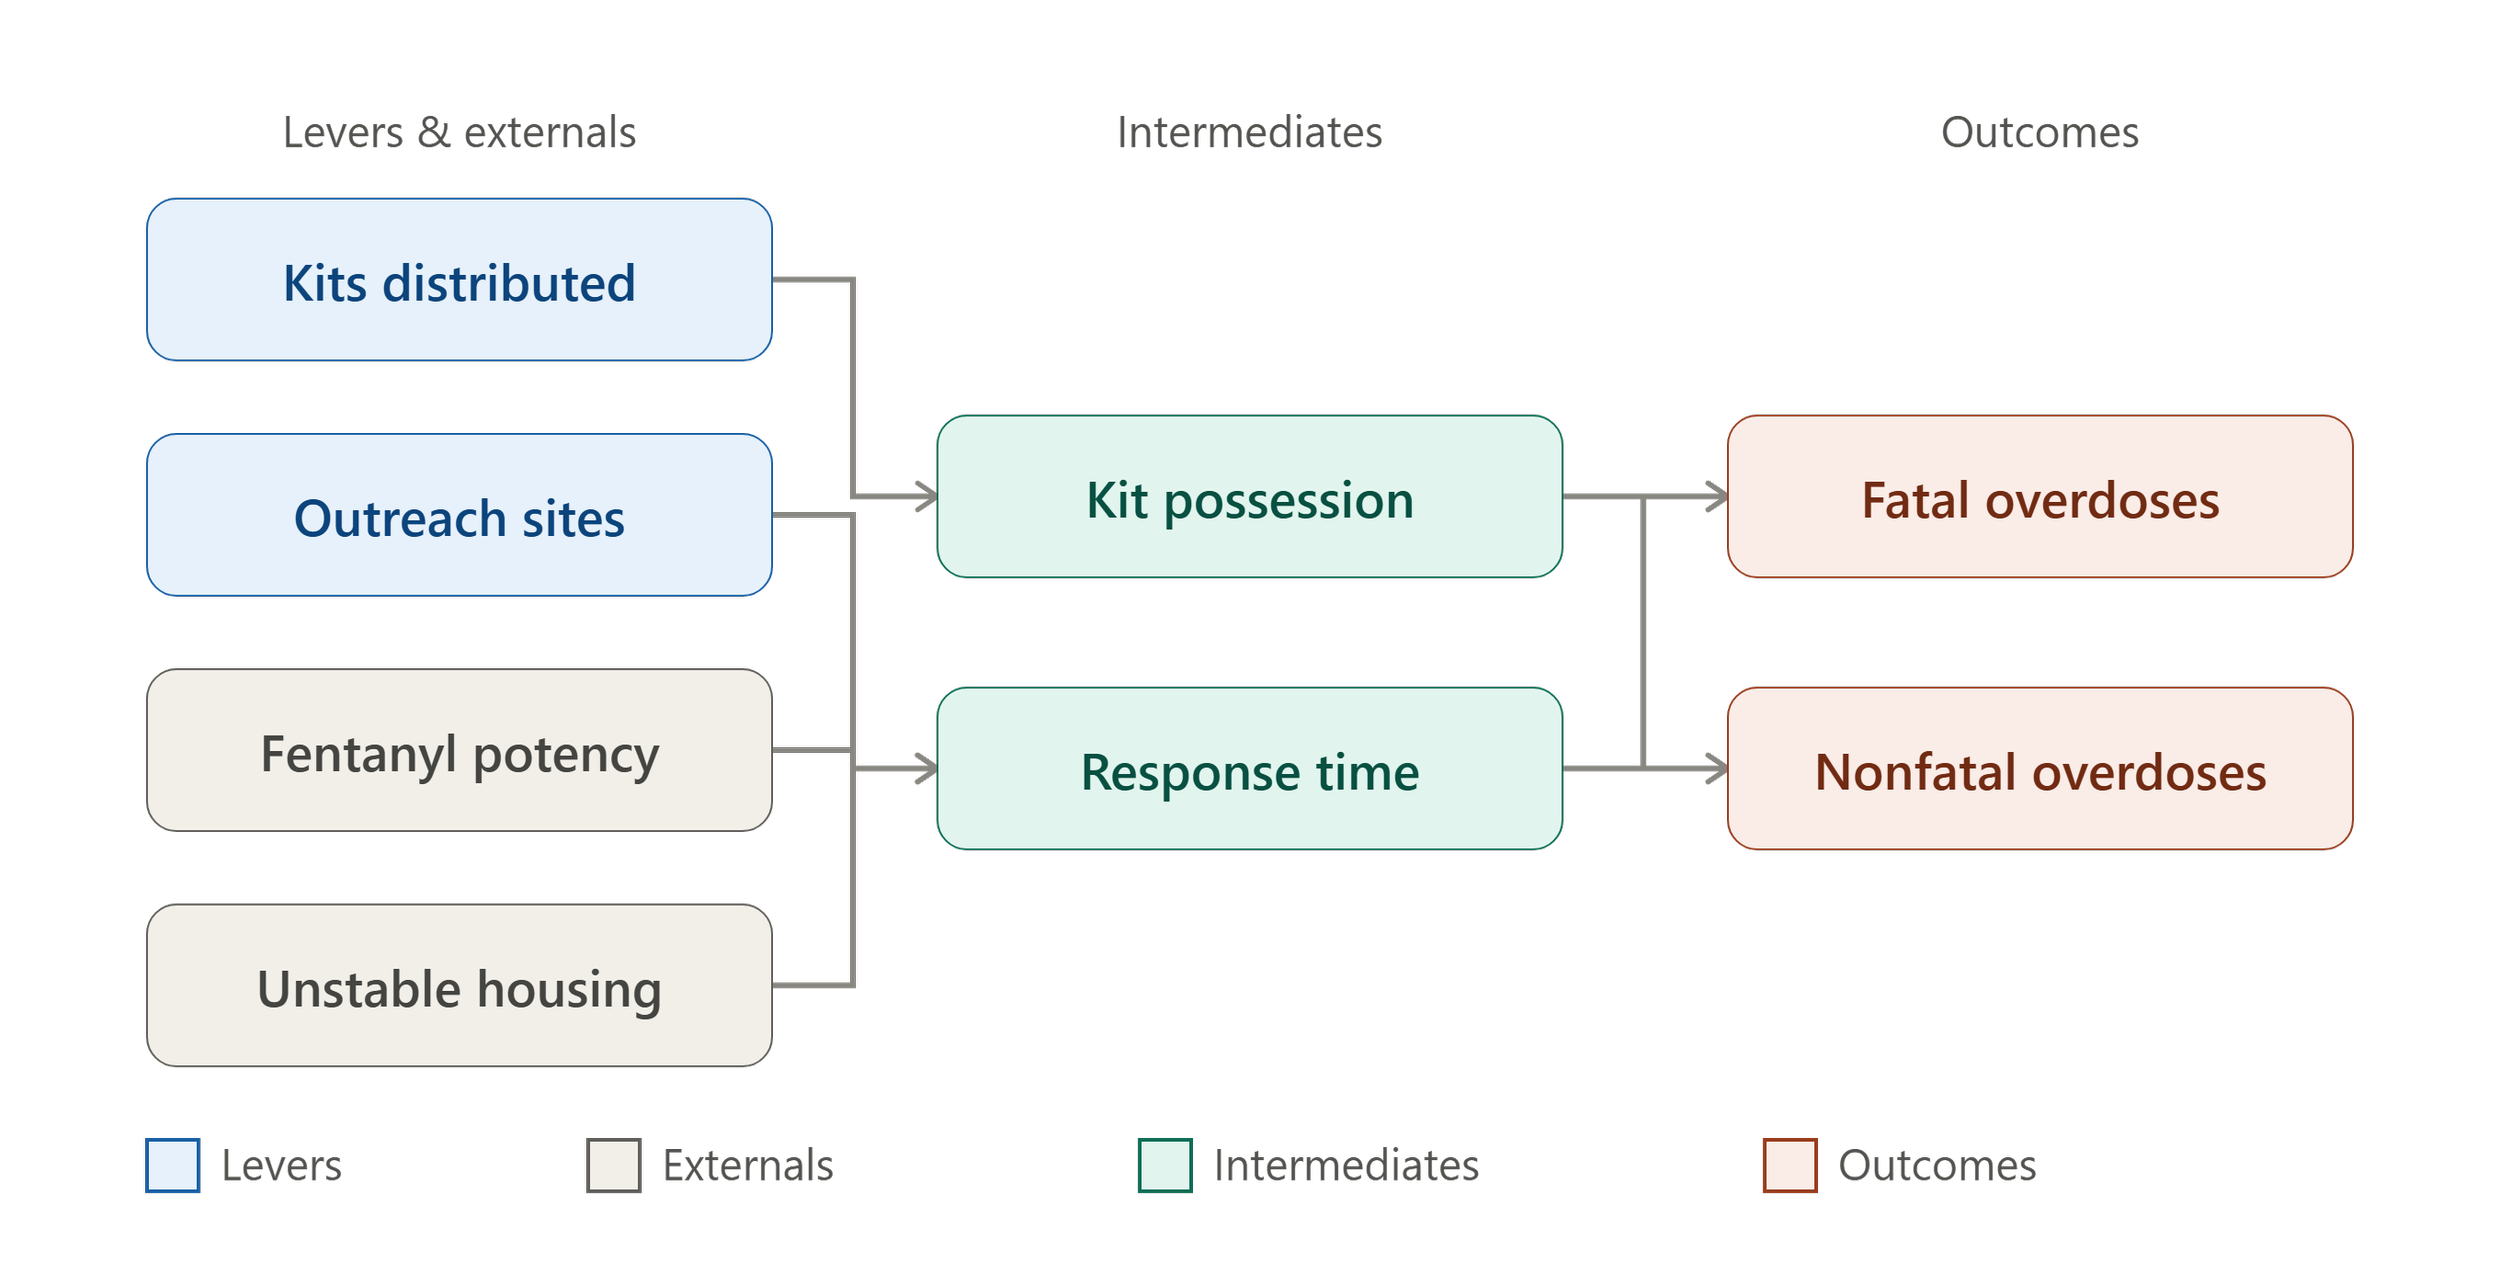
A simple Causal Decision Diagram (CDD) for a naloxone distribution program.
Causal discovery asks: given the data we actually have on these variables, is this the causal structure that best explains it or do the data suggest a different one? Maybe unstable housing turns out to affect kit possession directly, by making it harder to store and carry a kit reliably, rather than only affecting response time as the team first assumed. Maybe a variable treated as independent turns out to be linked to two others at once.
Different causal discovery algorithms approach this question in different ways. Some test statistical relationships between variables directly (constraint-based), some search for the structure that best fits the data overall (score-based), and others assume a specific mathematical form for how variables interact (functional). In practice, analysts often try several approaches and compare results. The output is a data-driven diagram that you can hold up against your team's CDD.
While powerful, causal discovery has two important limits to recognize. First. many CDDs that model wicked problems include feedback loops. In our example, more nonfatal overdoses in a neighborhood might prompt the health department to open an additional outreach site there, which is itself one of the levers. Most causal discovery algorithms require a diagram with no loops, so they handle this by "unrolling" the loop across time: instead of one node for "outreach sites" feeding back into itself, the data is split into a sequence of snapshots (outreach sites this month, overdoses this month, outreach sites next month, and so on), so that every arrow flows forward in time from an earlier snapshot to a later one. The loop drawn in the CDD becomes a straight, repeating chain once time is factored in.
The second limit is that causal discovery can tell you that something seems to be missing from your diagram (a gap or an unexplained relationship) but it can't tell you what that missing piece is or how many there might be. If the data-driven diagram and your team's CDD disagree, that's a signal to go back to your subject matter experts: are there factors we didn't account for? Should an arrow point somewhere different than we assumed? Causal discovery flags the disagreement; people still have to resolve it.
Causal Inference: From Diagram to Recommendation
Just as important as the estimate itself is its uncertainty. An estimated 10% improvement with a plus-or-minus of 10% is very different than a 10% improvement with a plus-or-minus of 1%. That first confidence interval tells you the best intervention might be to do nothing some of the time. Good causal inference reports both the estimate and its uncertainty.
Calculating a point estimate involves three steps:
- Identify the estimand. Before you can estimate anything, you have to know precisely what you're estimating. This step uses the CDD to work out which variables need to be accounted for (or "controlled for") to isolate the effect of your intervention and, just as importantly, which variables should not be controlled for. Counterintuitively, controlling for the wrong variable can create the appearance of a confounding relationship that doesn't actually exist. For a simple diagram, an analyst can often work this out by inspection; for more complex, "wicked" policy problems, specialized software is needed to make sure nothing is missed. In our example, this step would determine: to isolate the effect of kits distributed on fatal overdose rates, do we need to account for fentanyl potency? Housing instability? Both, neither?
- Calculate estimates. With the estimand defined, the next step is to actually calculate it from the data, typically expressed as a probability, a likelihood, or an effect size. The central question here is which estimator to use: a specific algorithm that will produce the number. Analysts often test several before settling on one. If you need to know not just the average effect but how it differs across sub-populations (for instance, whether an outreach site helps more in neighborhoods with higher housing instability than in more stable ones) more advanced estimators can capture that variation.
- Refutation. An estimate is only useful if you know when to trust it. This step is conceptually similar to a placebo-controlled trial in medicine: analysts run a series of tests designed to see whether the estimated effect holds up, or whether it could just as easily be explained by chance. This is the uncertainty of the point estimate. Common tests include swapping in a random "fake" intervention to see if the model still reports an effect (it shouldn't), adding random unrelated variables to see if the estimate changes when it shouldn't, and checking how sensitive the result is to variables that might be missing from the model. That last check is particularly valuable: it can reveal the presence of hidden confounders even after causal discovery has already tried to catch them.
Why Machine Learning Alone Isn't Enough
Why can't we just use machine learning (ML) to do all this? A standard ML model is built to find patterns that predict an outcome well, not to tell you what would happen if you changed something (an intervention) or what would have happened if a different intervention had been applied (a counterfactual). Fed only historical data with lots of features, it might learn that neighborhoods with more outreach sites also have more overdoses simply because sites tend to get placed where overdoses are already common and then recommend cutting sites in exactly the places they're helping most. Without the causal structure to sort cause from effect, the model has no way to tell "outreach sites reduce overdoses" apart from "overdoses cause outreach sites to be opened." Pairing that model with a large language model doesn't close the gap either: an LLM can produce a fluent, confident-sounding explanation of which factors matter, but it's drawing on patterns in text, not mathematically testing anything against your county's actual data, so it can generate a plausible causal story that's simply wrong for your situation, with no real uncertainty estimate attached. In constrast, causal discovery and inference address these issues directly, by building and testing the causal structure itself rather than assuming a model that predicts well is telling you anything about the effect of an intervention.
That isn't to say that there is no role for machine learning in causal inference - quite the opposite is true. However, these more specialized types of machine learning depend on a well-structured causal model and the assumptions above: all confounding variables must be known and measured, and the treated individuals must be independent from the untreated. Under these conditions, causal inference often makes use of approaches like double machine learning, causal forests, and doubly robust learners to generate the estimates in Step 2 above.
The Entire Recommendation System
Putting these pieces together yields something new: an estimator that can take in the details of a new case and output a predicted effect for that specific intervention compared to differently-treated cases, given all of the other measured causal inputs in the system, and with a sense of how confident to be in that prediction. Inputting a proposed number of kits, a specific outreach site, and current conditions in that neighborhood will output a predicted effect on overdose deaths and ED visits. Plugged into a data pipeline and a user interface, that's a recommendation engine: feed in new cases, get back calculated effects, on a recurring basis rather than as a one-time analysis.Not every decision needs this level of rigor. For many problems, the CDD alone is enough to align stakeholders and sharpen a decision. But for public health problems like this one, where decisions are recurring, high-stakes, and scrutinized, this approach offers something a simpler model can't: a recommendation and a transparent account, via the CDD, of exactly what that recommendation does and doesn't take into account. The combination of a defensible number plus a legible explanation of where it came from is what makes decision intelligence, paired with causal inference, particularly well suited to public policy work.
Further Reading
Molak, A. Causal Inference and Discovery in Python: Unlock the Secrets of Modern Causal Machine Learning with DoWhy, EconML, PyTorch and More.(Packt Publishing, Birmingham, UK, 2023).
Pearl, J. An Introduction to Causal Inference. Int. J. Biostat. 6,7 (2010).
Huber, M. An Introduction to Causal Discovery. Preprint at https://doi.org/10.48550/arXiv.2407.08602 (2024).
Feature image by DiamondRehabThailand from Pixabay.